This 2014 NFL season has seemed incredibly bizarre to me in that it seems as if, for the first time, the running game is almost irrelevant. It appears as if the NFL has reached the peak of a steady progression to a pass-only league, where running backs only matter when they are catching passes. However, I wanted to see if there is any substance to this feeling, so I decided to crunch the numbers. I analyzed the numbers from two perspectives: the players’ and the teams’.
I first analyzed trends in individual running back statistics. I measured the trends in average rushing attempts per game, average rushing yards per game, average yards per carry per game, and average total rushing touchdowns; I took data starting from the 2006 season up through 2014, though I only measured up to Week 13 each year because that is how far the 2014 season has progressed. The running backs I used each season were the top 64 in number of carries as of Week 13 (the top 64 can account for a committee of two running backs for every team).
In regard to average attempts per game (Figure 1), it reached its peak in 2007 with 12.99 carries. The data then exponentially declined until 2011, where the average number of attempts was 11.87. After shooting back up in 2012, the numbers fell linearly to this year. 2014’s 11.74 carries per game is the lowest it has been beginning with 2006.
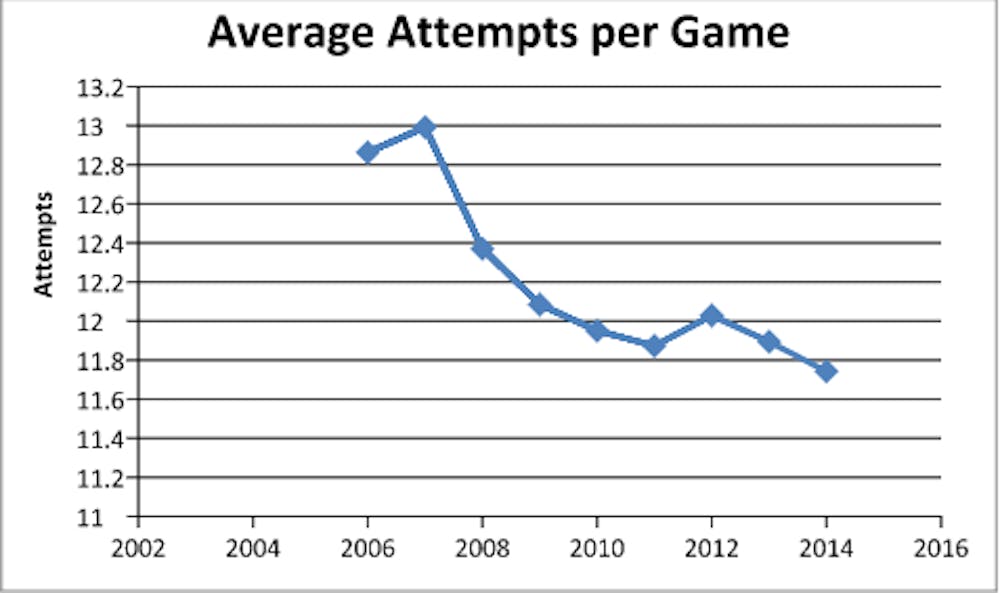
Figure 1
The fact that the number of attempts per game for individual running backs could mean one of two things: either teams are progressively using more running backs by committee, or they simply are running less. Strangely, not all of the data of individual running backs reflects this conclusion.
In average rushing yards per game (Figure 2), the overall trend was similar to that of attempts. The average yards peaked in 2007 at 53.79 yards per game. Though the data did not follow the same exponential decay of attempts, the numbers still steadily decreased until 2013, where they hit the significantly lower mark of 47.84 yards per game. This season, that number has risen almost a full yard to 48.74, but it is still quite less than the average yards in 2006-2012.
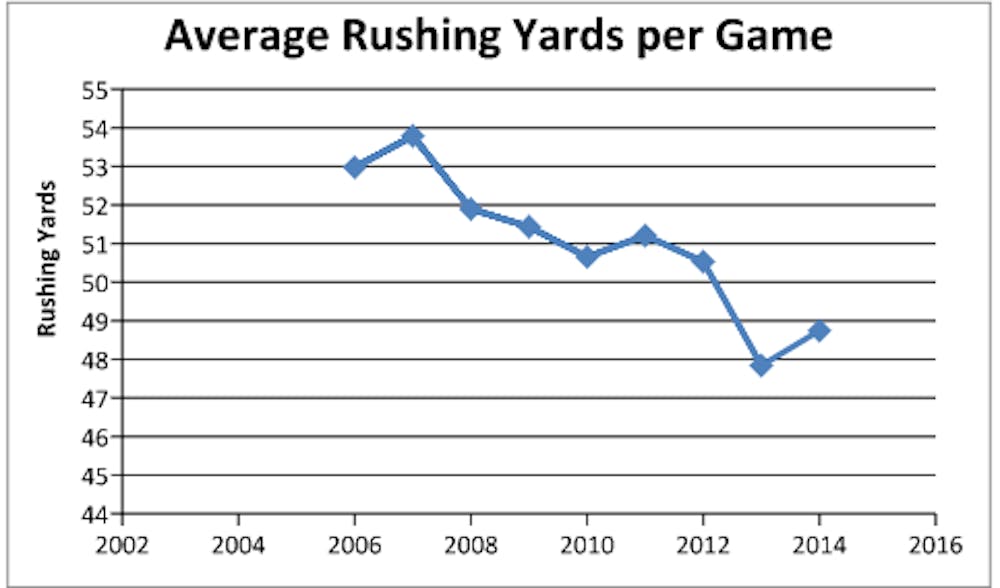
Figure 2
These results could indicate either simply less running or worse running in general. The next statistic, though, will eliminate one of those two possibilities.
Average yards per carry per game (Figure 3) differed from all the other categories in trend. Essentially, there was no consistent trend; the numbers alternated from low yards per carry to high yards per carry every year. The lowest average yards per carry surprisingly came in 2006 with 3.898 yards per carry, slightly less than 2013’s 3.900. However, the most shocking result is that 2014 has the third-highest average at 4.086 yards per carry.
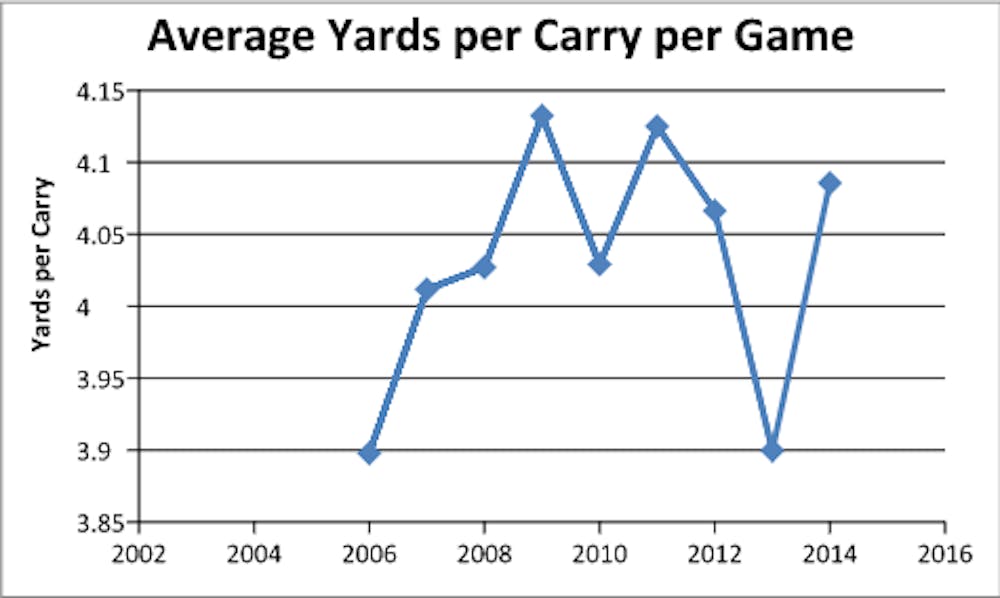
Figure 3
This information means that running backs this year have been highly efficient and have actually performed quite well given the number of carries they have received. Given this high rushing efficiency, why are the backs not rushing more?
Another strange piece of information is the average total number of rushing touchdowns per running back as of Week 13 each season (Figure 4). This stat reached a high peak of 4.64 in 2008, but it then fell back down and has stayed relatively constant ever since 2011. Technically, the average total touchdowns this season is at its lowest, with a value of 3.28, but it is not that much lower than any of the rest of the information.
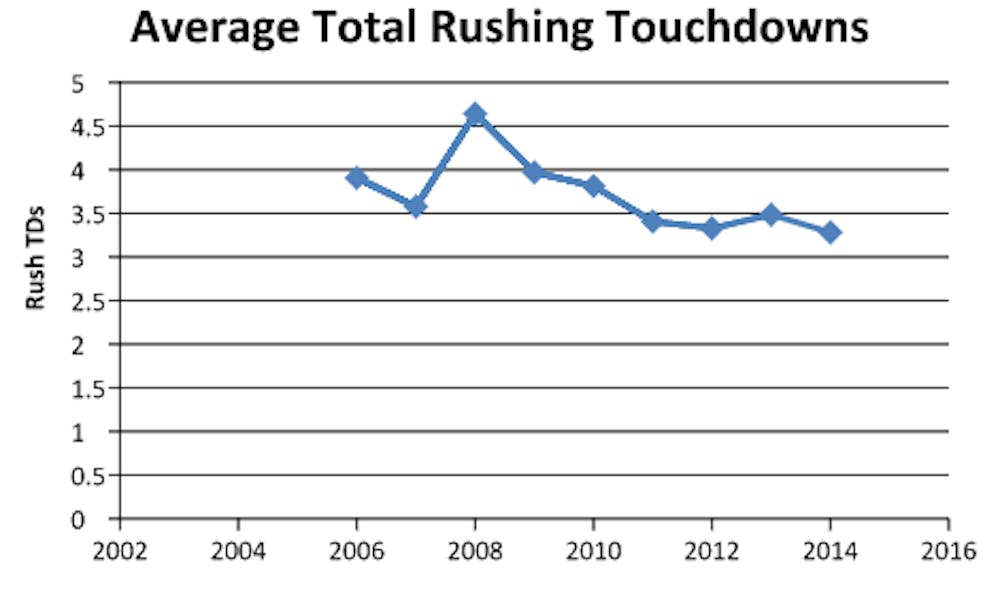
Figure 4
This trend could mean that teams are not really using their running backs less in goal line territory than they have in years past, though the numbers could potentially be skewed by a large amount of long rushing touchdowns. Regardless, my analysis of these categories shows that the number of attempts has dropped dramatically, as have rushing yards per game, yet efficiency is incredibly high and touchdowns have remained constant. This data does not really make much sense or clear up confusion. Are teams just using more running backs, which makes each back more rested? A more rested back could be more efficient, and, if teams are still running as much as they always have, then it would make sense for touchdowns to be about the same. The other possibility is that teams are simply not running as much. In that case, carries and yards would drop, but efficiency could increase due to a more rested back or the defense not expecting a run. Football tradition would keep backs having their Red Zone carries and unsuspecting defenses could be more susceptible to long TD runs. But which is correct?
To get closer to an answer, I also analyzed the rushing data from the individual teams since 2006 and averaged them. Specifically, I looked at average total rushing yards per game for the teams in general and what percentage of a team’s plays were running plays. Team rushing yards per game (Figure 5) tells a slightly different story from individual rushing yards. Where individual running backs reached their highest average in 2007, the team average was, by far, the lowest in that same year (109.60). However, 2014 still has the second-lowest average at 111.34 yards per game.
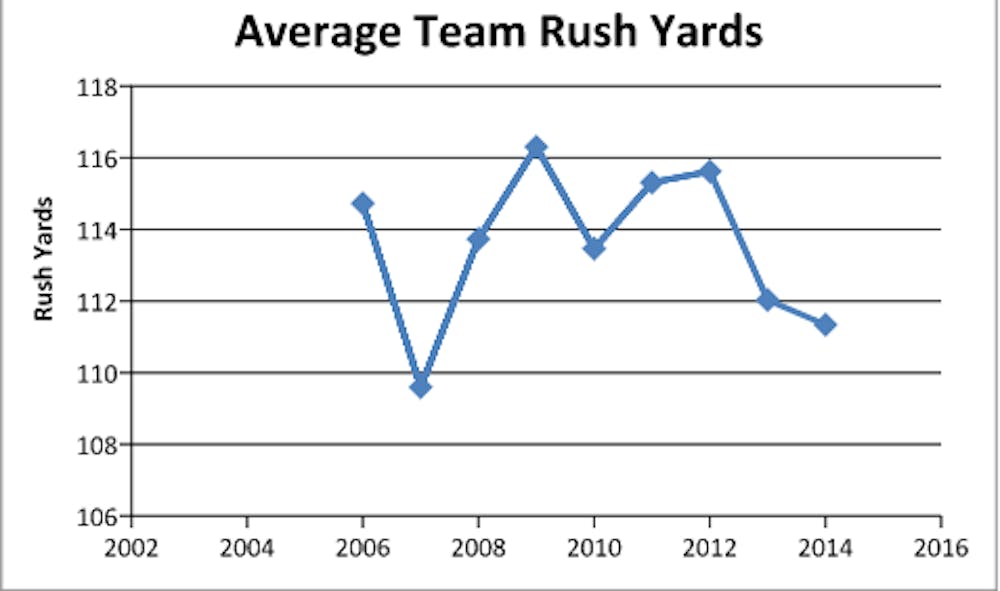
Figure 5
The oddity of 2007 indicates that teams used fewer backs that year, but each back did reasonably well. It also marks the beginning of high popularization of running back by committee, as team rushing yards increased while individual rushing yards decreased. However, the committees of 2014 still have not performed up to the standards set by previous seasons. Something else is adding to the mix.
The final thing I analyzed was the average rush percentage (Figure 6). This statistic is an indication of what percentage of offensive plays called, on average, were runs. Though the progression of this statistic bounced up and down slightly, it was at its maximum in 2006, with teams calling a running play 46.18% of the time. Overall, this statistic has plummeted. It reached its minimum in 2013, where teams called runs on only 43.05% of their plays, but it has only increased slightly this year, rising to a mere 43.16%.
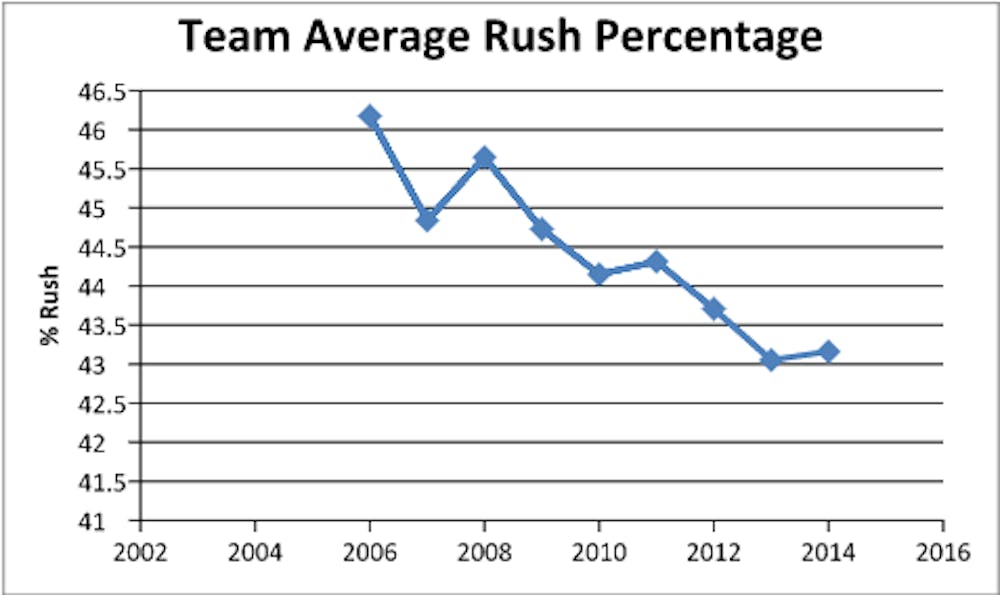
Figure 6
This statistic is really the missing piece. It indicates that teams are running much, much less than they were six, seven, or eight years ago. With teams running the ball less, the running backs are not performing as well.
Overall, both team statistics explain the trends seen in the individual running back stats. Players are receiving fewer carries because teams are running the ball less, and, when they do run the ball, they use committees instead of single backs. Rushing yards per game are also lower both as a result of running by committee and less running in general. Players are running more efficiently, however, most likely a result of the rest they receive from being in a committee that does not run much anyway and defenses no longer expecting teams to run the ball. Touchdowns, however, have remained the same, either as a result of continued usage in the Red Zone or longer touchdown runs. Regardless, the NFL has steadily shied away from the days where one star back carried the team. The NFL is no longer a league defined by its running backs, different from the eras of Jim Brown, Walter Payton, and Emmitt Smith. This is a league for the quarterback, by the quarterback. Passing records keep falling, more QBs seem Hall of Fame eligible, and we observe what is now a passing league.
Follow Zak on Twitter @zakberliner1 and listen to him on "The War Room" Fridays from 6-7 pm
